The PF2 is a profitable performer
We're confident that the PF2 is built on a profitable foundation. Unlike most automated bots,
which only provide 6-12 months of past performance data, the PF2's performance data stretches back 47 months - from January 2022 to November 2025.
That's nearly four years of consistent performance. This data is presented with full transparency.
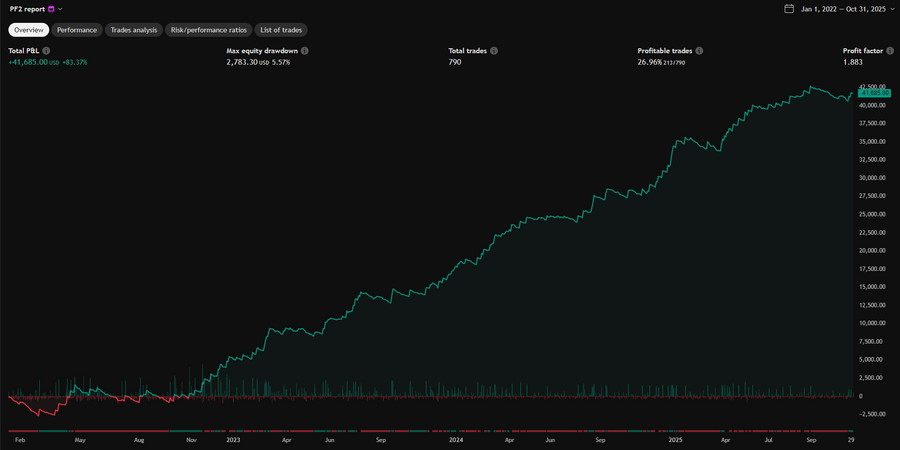
MNQ Results (2 lots)
Four years of strong results
More than $40,000 over the 46-month term. Drawdown under $3,000
(Click the image to enlarge)
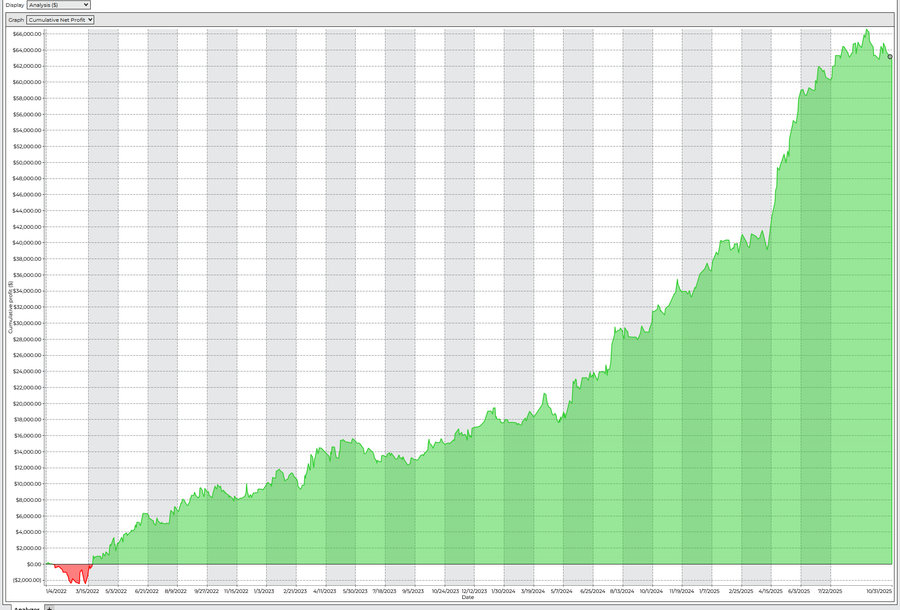
mgc results (4 lots)
Gold is golden with the PF2
More than $60,000 over the 46-month term. Drawdown under $4K
(Click the image to enlarge)
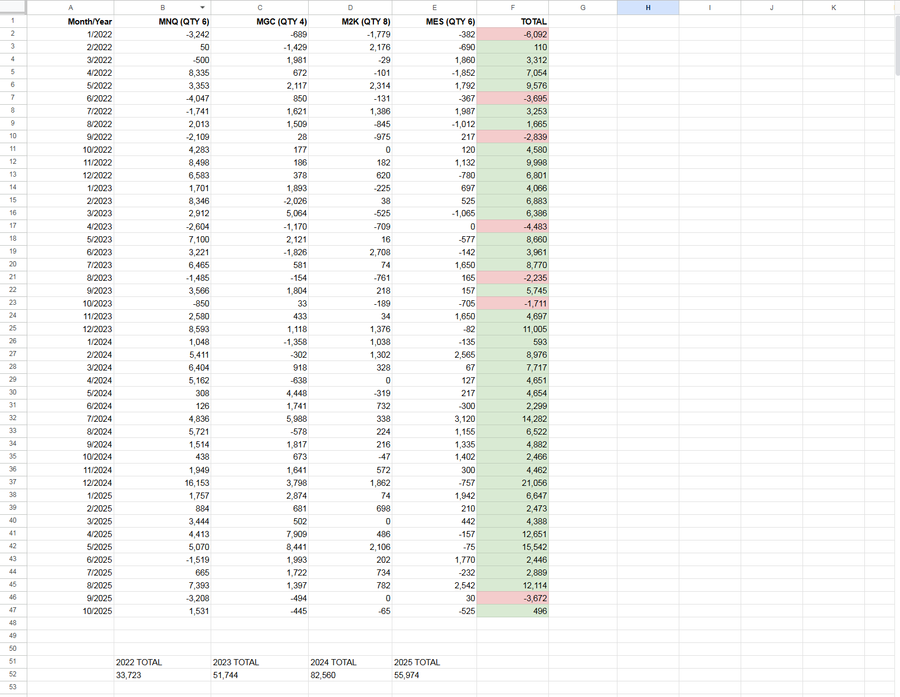
Full performance data
Micro assets full results
These are the backtested results over the 46 month term - from January 2022 to October 2025.
The quantities are listed at the top and you can backtest these same results with the PF2.
(Click the image to enlarge)
What does it all mean?
Traders need certainty and proven performance from any system that they adopt.
We designed the PF2 to excel over a timeline that other bot developers won't even try to test.
This is no fly-by-night operation. We use the PF2 in our own trading and believe that removing psychology from the process - which is unreliable - is the way forward for struggling traders.

Performance data included with guide
We include a detailed user guide
with every purchase of the PF2.
In addition to step-by-step installation and customization instructions, we've included a section on the PF2's performance that lists:
Expected max drawdown
Expected win rates
Expected win/loss ratios
Expected average winners/losers
The goal is to help traders precisely calculate their risk before executing trades with the PF2.

PF2-LIVE
Text block

PF2-PROP
Text block